5.2.1. Quality Assurance#
Instructions on how to to verify a successful CMAQ Run on ParallelCluster.
5.2.2. Run m3diff to compare the output data for two runs that have different values for NPCOL#
cd /fsx/data/output
ls */*ACONC*
setenv AFILE output_v54+_cb6r5_ae7_aq_WR413_MYR_gcc_2018_12US1_2x64_classic/CCTM_ACONC_v54+_cb6r5_ae7_aq_WR413_MYR_gcc_2018_12US1_2x64_classic_20171222.nc
setenv BFILE output_v54+_cb6r5_ae7_aq_WR413_MYR_gcc_2018_12US1_3x64_classic/CCTM_ACONC_v54+_cb6r5_ae7_aq_WR413_MYR_gcc_2018_12US1_3x64_classic_20171222.nc
m3diff
hit return several times to accept the default options
grep A:B REPORT
Should see all zeros.
Recompiled CMAQ using -march=native compiler option for gcc compiler, but still see differences in answers. The answers are the same, or the differences are all zeros if the domain decomposition uses the same NPCOL, here, NPCOL differs (10 vs 16)
This behavior is different from what was observed with removing the -march=native compiler option for gcc on the AMD Cyclecloud HBV3 processor. On cycle cloud, if CMAQ is compiled with -march=native removed from the compiler options, then the answers match if NPCOL differs.
@ NPCOL  =  8; @ NPROW =  16
@ NPCOL  =  12; @ NPROW =  16
grep A:B REPORT
output
 A:B  9.31323E-10@( 78,122, 1) -9.31323E-10@(173, 98, 1) -1.67066E-14  1.11030E-11
 A:B  3.72529E-09@(272,162, 1) -7.45058E-09@(271,162, 1) -4.96030E-14  4.09644E-11
 A:B  7.45058E-09@( 51,109, 1) -7.45058E-09@( 39,191, 1)  3.67334E-14  8.05492E-11
 A:B  9.31323E-09@(270,159, 1) -8.14907E-09@(189, 41, 1)  4.33809E-13  1.57138E-10
 A:B  1.86265E-08@( 53,108, 1) -1.30385E-08@( 54,108, 1)  8.53858E-13  2.42891E-10
 A:B  4.09782E-08@(326,165, 1) -1.90921E-08@(327,166, 1)  1.49534E-12  3.98158E-10
 A:B  1.55531E-07@(326,165, 1) -8.19564E-08@(233,101, 1)  2.42760E-12  1.00020E-09
 A:B  1.77883E-07@(325,167, 1) -1.11759E-07@(324,170, 1)  1.29720E-12  1.93561E-09
 A:B  1.94646E-07@(325,167, 1) -1.36439E-07@(331,163, 1)  1.38651E-11  2.77102E-09
 A:B  1.69501E-07@(134,119, 1) -2.81259E-07@( 50,223, 1)  2.44340E-11  3.76379E-09
CMAQv5.4+ does not have -march=native compile option as a default in the Makefile
Even with NPCOL the same, the answers are not matching.
more REPORT_3x64vs4x64
     FILE A:  AFILE (output_v54+_cb6r5_ae7_aq_WR413_MYR_gcc_2018_12US1_3x64_classic/CCTM_ACONC_v54+_cb6r5_ae7_aq_WR413_MYR_gcc_2018_12US1_3x64_classic_20171222.nc)

     FILE B:  BFILE (output_v54+_cb6r5_ae7_aq_WR413_MYR_gcc_2018_12US1_4x64_classic/CCTM_ACONC_v54+_cb6r5_ae7_aq_WR413_MYR_gcc_2018_12US1_4x64_classic_20171222.nc)


     -----------------------------------------------------------


 Date and time  2017356:000000 (0:00:00   Dec. 22, 2017)
 A:AFILE/NO2  vs  B:BFILE/NO2  vs  (A - B)
      MAX        @(  C,  R, L)  Min        @(  C,  R, L)  Mean         Sigma
 A    6.07607E-02@(185, 12, 1)  2.09545E-06@(313,285, 1)  1.37065E-03  2.83485E-03
 B    6.07607E-02@(185, 12, 1)  2.09545E-06@(313,285, 1)  1.37065E-03  2.83485E-03
 A:B  3.72529E-09@(374,170, 1) -3.72529E-09@(377,170, 1) -3.22105E-14  2.88679E-11


 Date and time  2017356:010000 (1:00:00   Dec. 22, 2017)
 A:AFILE/NO2  vs  B:BFILE/NO2  vs  (A - B)
      MAX        @(  C,  R, L)  Min        @(  C,  R, L)  Mean         Sigma
 A    6.00488E-02@(185, 13, 1)  2.17908E-06@(303,251, 1)  1.39298E-03  2.87296E-03
 B    6.00488E-02@(185, 13, 1)  2.17908E-06@(303,251, 1)  1.39298E-03  2.87296E-03
 A:B  7.45058E-09@(271,162, 1) -9.31323E-09@(374,169, 1) -3.20415E-15  6.70979E-11


 Date and time  2017356:020000 (2:00:00   Dec. 22, 2017)
 A:AFILE/NO2  vs  B:BFILE/NO2  vs  (A - B)
      MAX        @(  C,  R, L)  Min        @(  C,  R, L)  Mean         Sigma
 A    5.68695E-02@(185, 13, 1)  1.81416E-06@(302,252, 1)  1.36102E-03  2.79681E-03
 B    5.68695E-02@(185, 13, 1)  1.81416E-06@(302,252, 1)  1.36102E-03  2.79681E-03
 A:B  7.45058E-09@( 39,191, 1) -4.65661E-09@(378,170, 1)  4.00549E-13  9.75052E-11
5.2.3. Run an R script to create the box plots and spatial plots comparing the output of two runs#
Examine the script to create the box plots and spatial plots and edit to use the output that you have generated in your runs.
First check what output is available on your ParallelCluster
If your I/O directory is /fsx
ls -rlt /fsx/data/output/*/*ACONC*
If your I/O directory is /shared/data
ls -lrt /shared/data/output/*/*ACONC*
Then edit the script to use the output filenames available.
cd /shared/pcluster-cmaq/qa_scripts
cp compare_EQUATES_benchmark_output_CMAS_pcluster.r compare_EQUATES_benchmark_output_CMAS_pcluster_hpc7g.18xlarge.r
vi compare_EQUATES_benchmark_output_CMAS_pcluster_hpc7g.18xlarge.r
#Directory, file name, and label for first model simulation (sim1)
sim1.label <- "CMAQv54+ 16x16 cores"
sim1.dir <- "/fsx/data/output/output_v54+_cb6r5_ae7_aq_WR413_MYR_gcc_2018_12US1_4x64_classic/"
sim1.file <- paste0(sim1.dir,"CCTM_ACONC_v54+_cb6r5_ae7_aq_WR413_MYR_gcc_2018_12US1_4x64_classic_20171222.nc")


#Directory, file name, and label for second model simulation (sim2)
sim2.label <- "CMAQv54+ 12x16 cores"
sim2.dir <- "/fsx/data/output/output_v54+_cb6r5_ae7_aq_WR413_MYR_gcc_2018_12US1_3x64_classic/"
sim2.file <- paste0(sim2.dir,"CCTM_ACONC_v54+_cb6r5_ae7_aq_WR413_MYR_gcc_2018_12US1_3x64_classic_20171222.nc")
Run the R script
cd /shared/pcluster-cmaq/qa_scripts
Rscript compare_EQUATES_benchmark_output_CMAS_pcluster_hpc7g.18xlarge.r
Note: your plots will be created based on the setting of the output directory in the script
An example set of scripts are available, but these instructions can be modified to use the output generated in the script above.
To view the PDF plots use the command:
cd /shared/pcluster-cmaq/qa_scripts/qa_plots
gio open O3_MAPS_CMAQ*.pdf
To convert the PDF to a jpeg image use the script convert.csh.
cd /shared/pcluster-cmaq/qa_scripts/qa_plots
First examine what the convert.csh script is doing
more convert.csh
output:
#!/bin/csh

foreach name (`ls *.pdf`)
  set name2=`basename $name .pdf`
  echo $name
  echo $name2
  pdftoppm -jpeg -r 600 $name $name2
end
Run the convert script.
./convert.csh
When NPCOL is fixed, we are seeing no difference in the answers.
Example comparison using: 16x16 compared to 12x16
Use display to view the plots
display O3_BOXPLOT_CMAQv54+16x16cores_vs_CMAQv54+12x16cores.jpeg
They are also displayed in the following plots:
Box Plot for ANO3J when NPCOL is identical for CMAQv5.3.3 (I didn’t see an identical plot for CMAQv5.4)
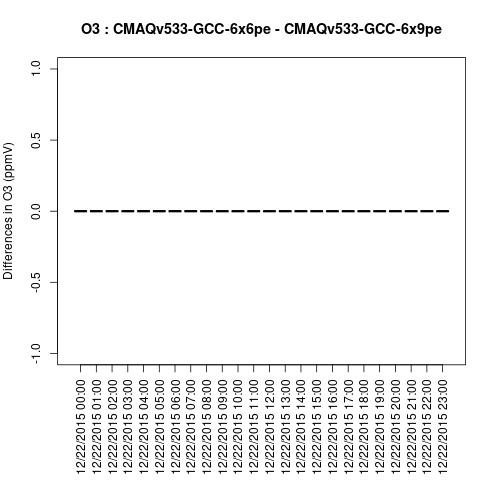
Box plot shows no difference between ACONC output for a CMAQv5.3.3 run using different PE configurations as long as NPCOL is fixed (this is true for all species that were plotted (AOTHRJ, CO, NH3, NO2, O3, OH, SO2)
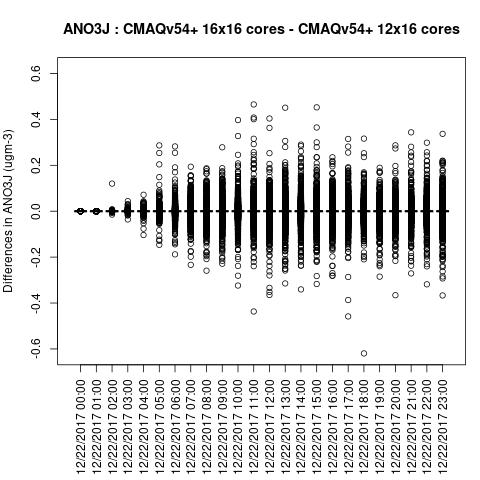
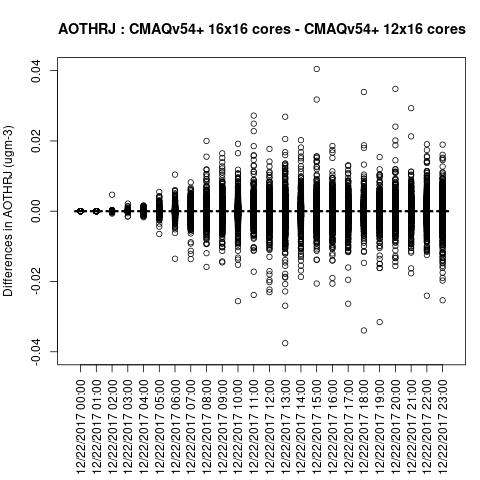
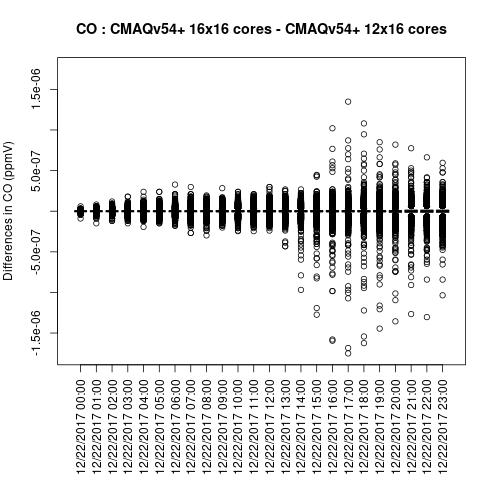
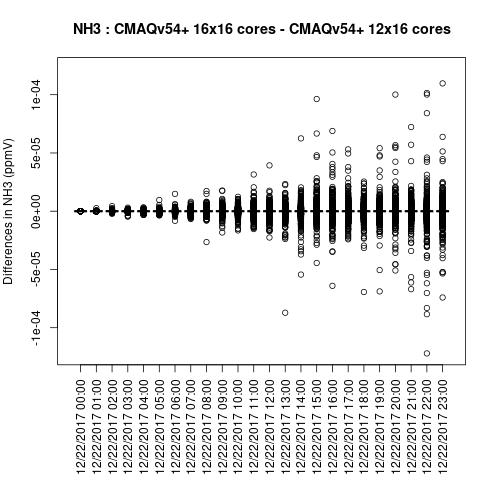
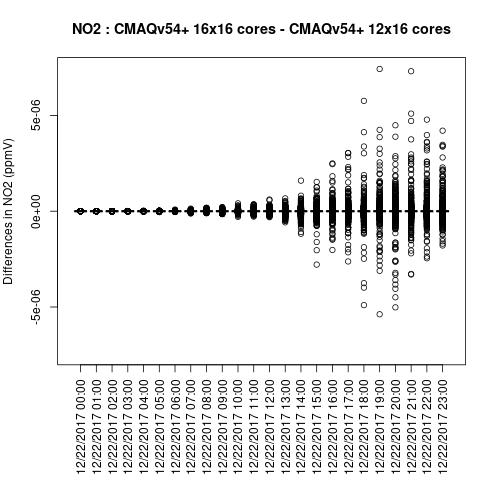
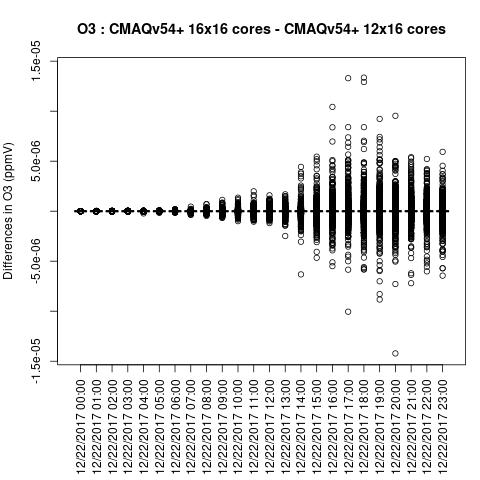
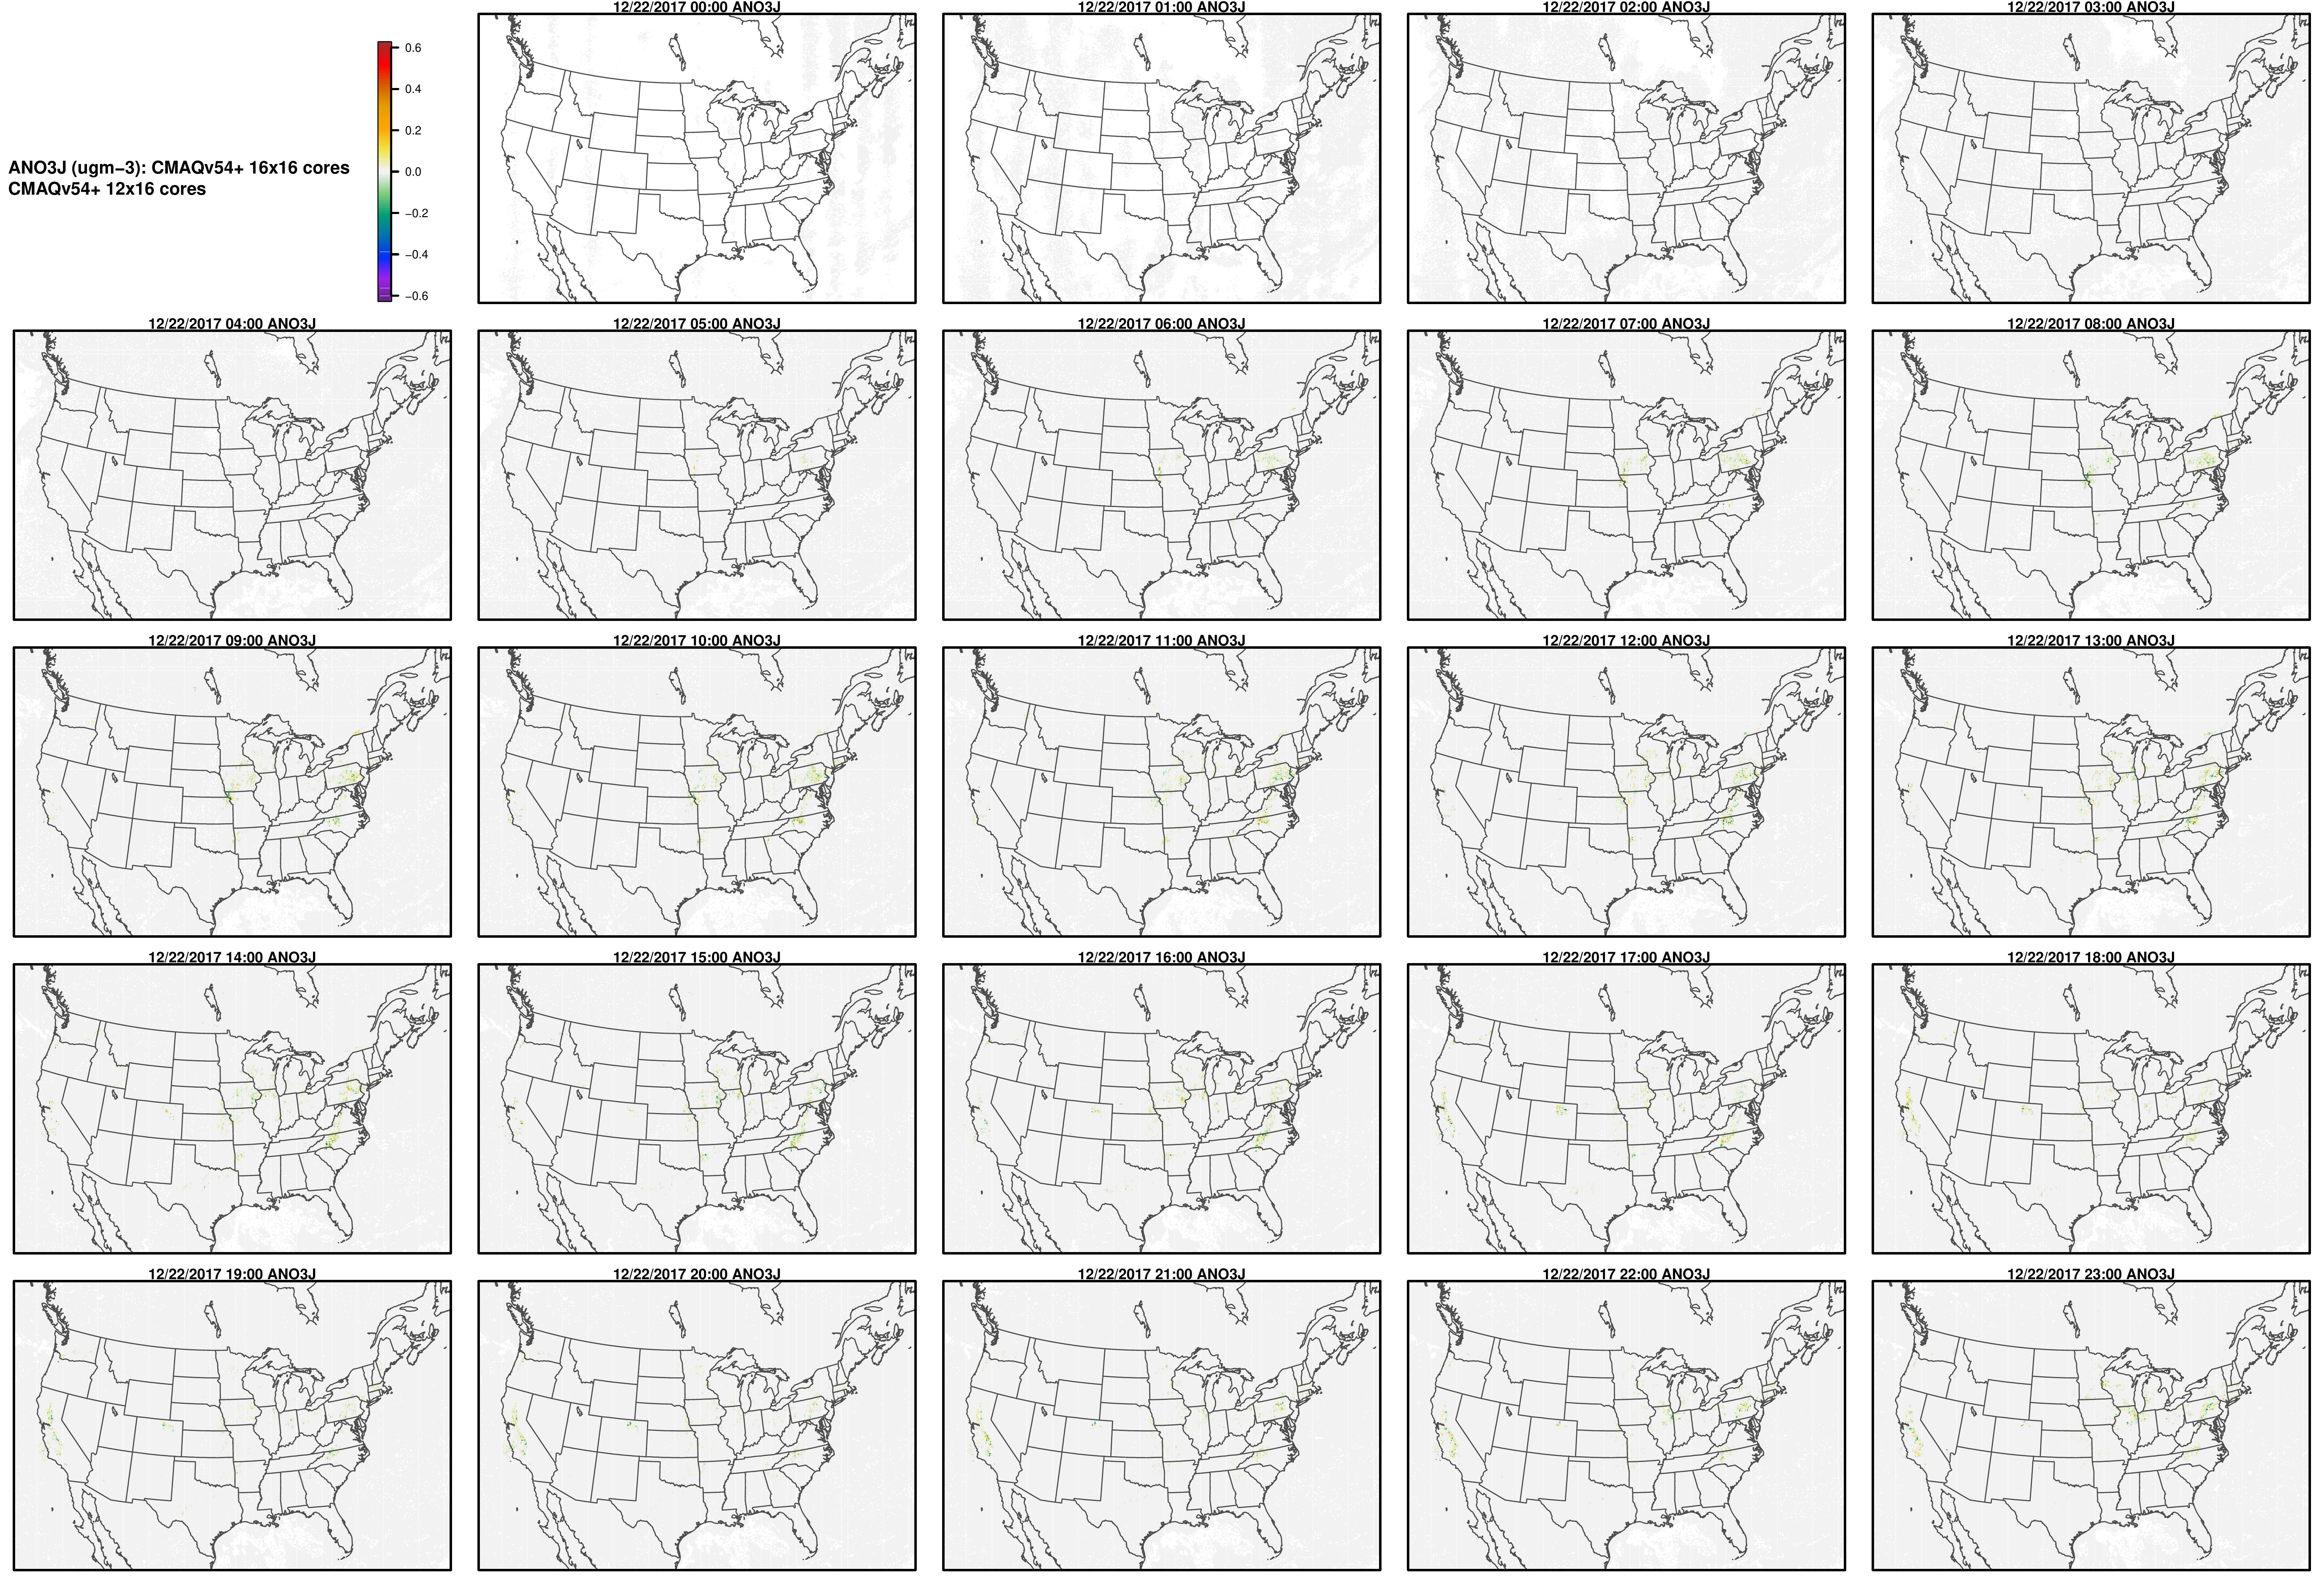
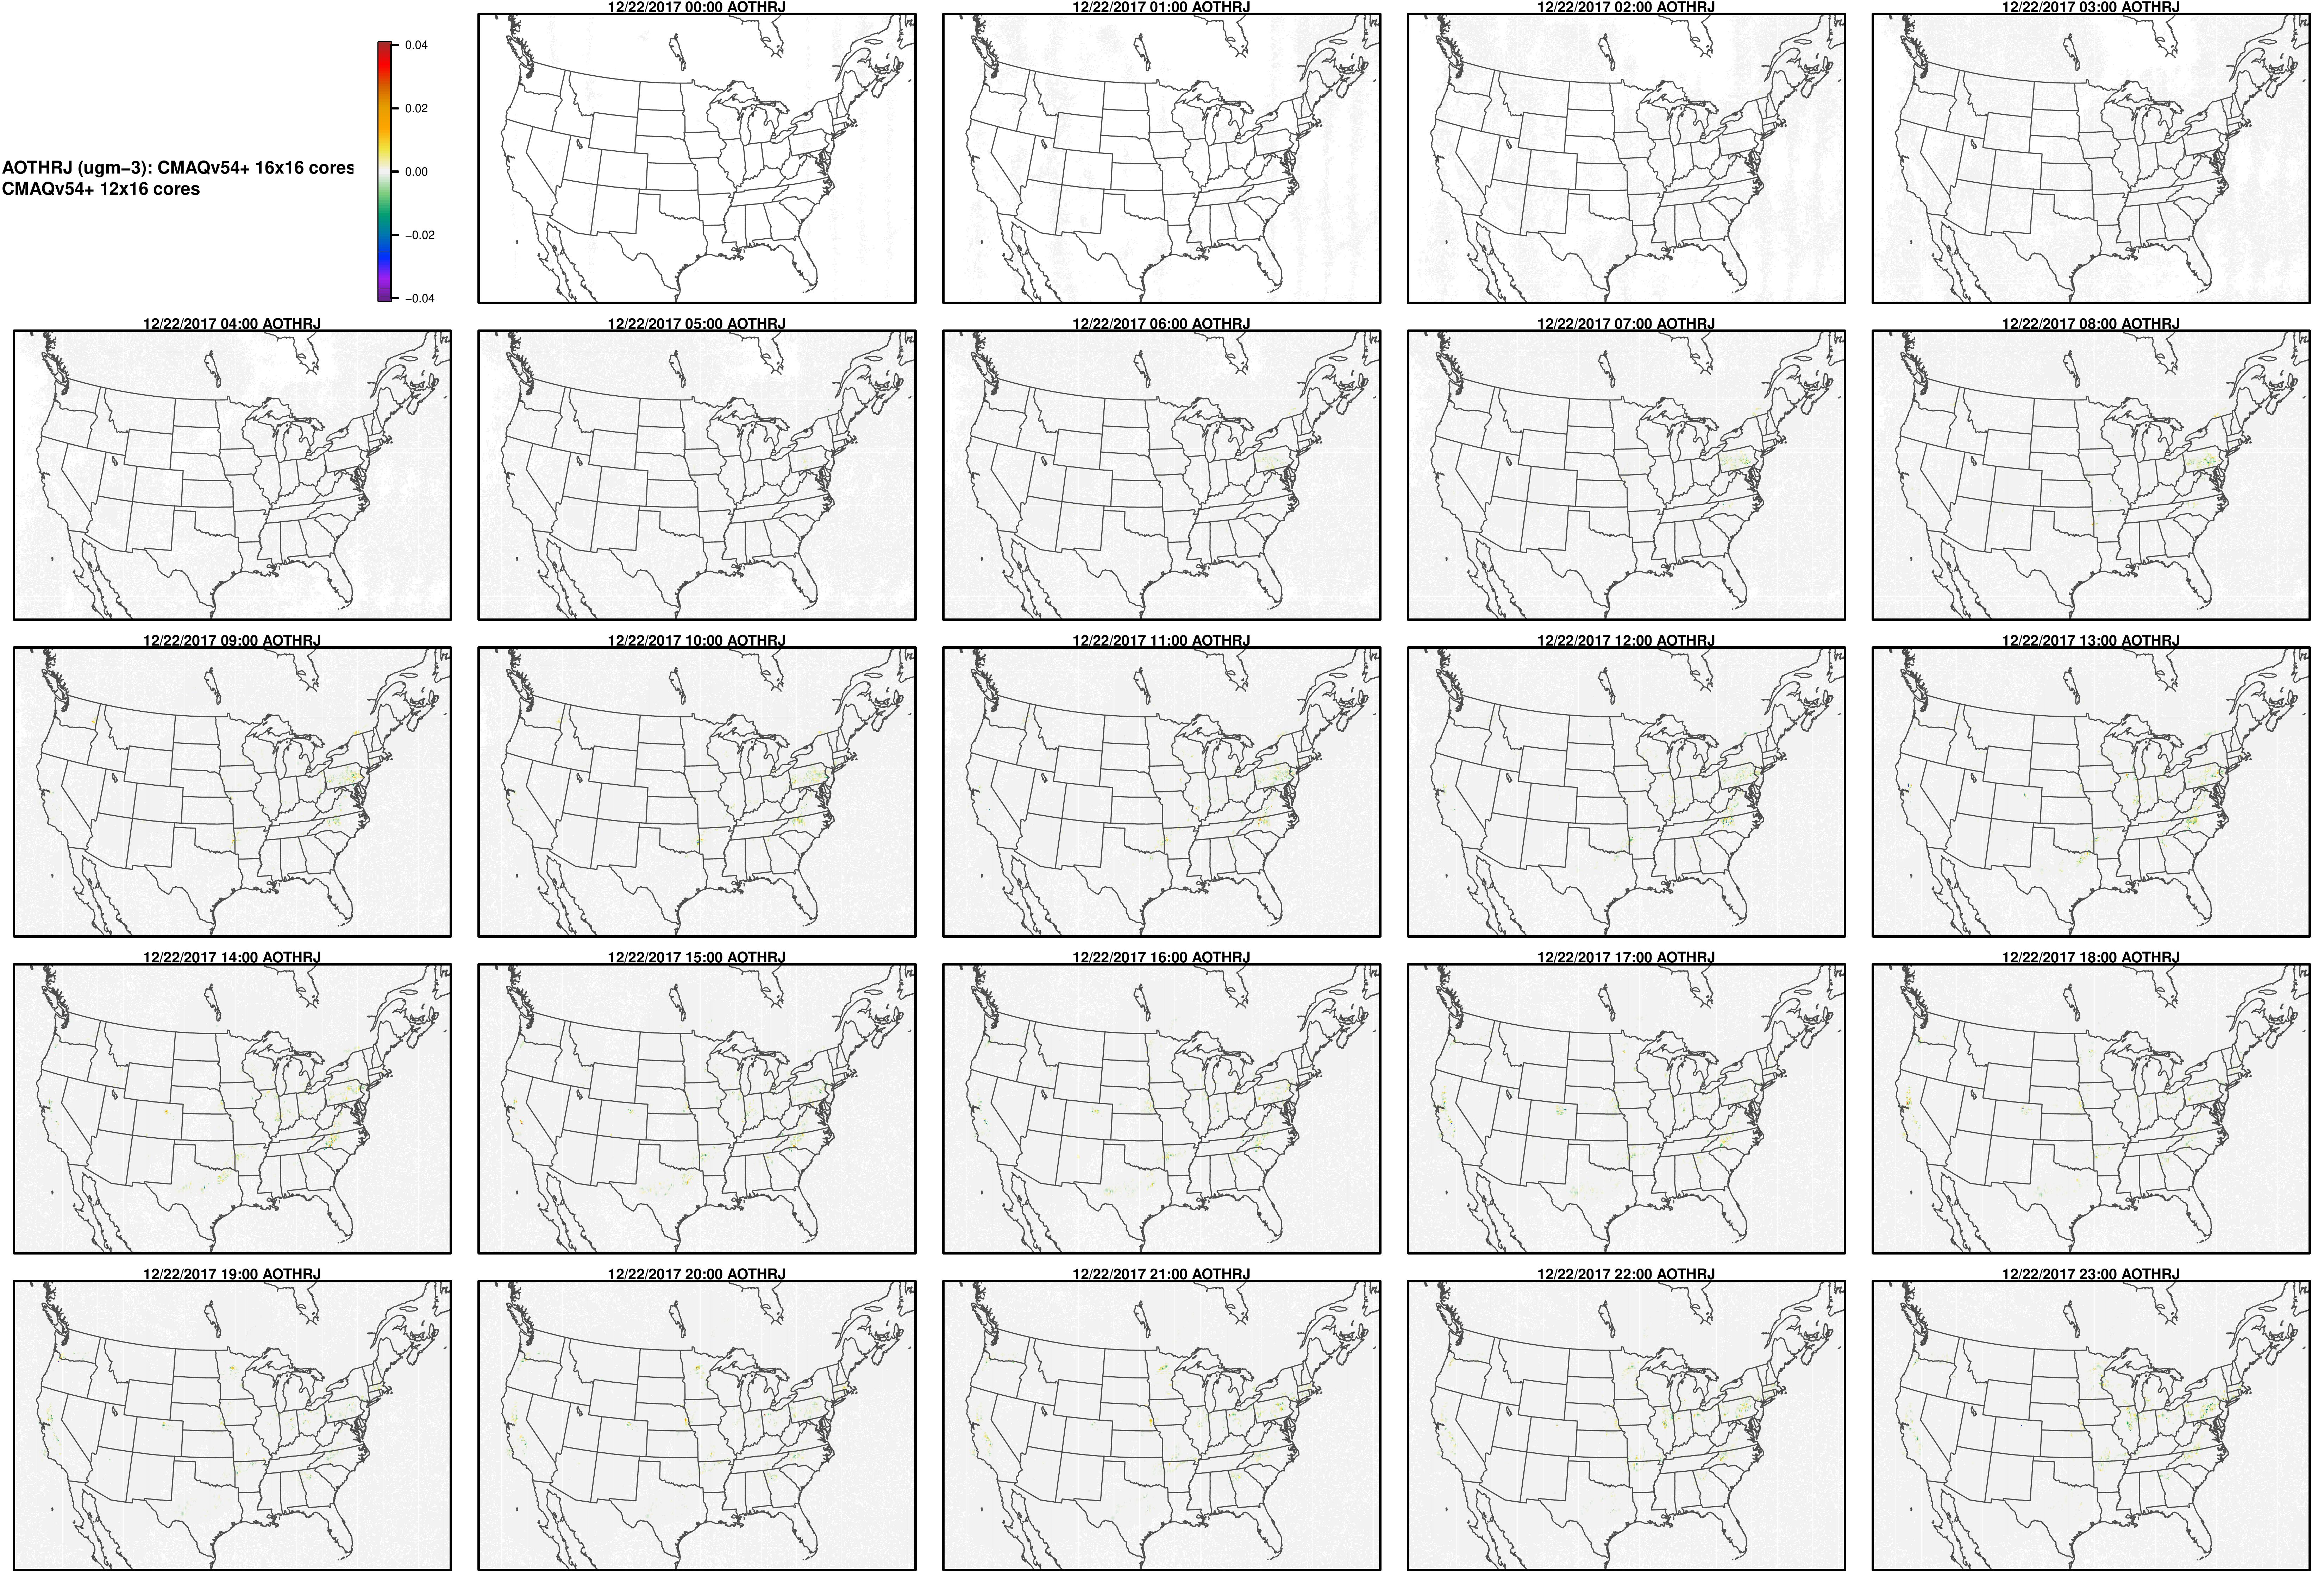
Box plot shows a difference betweeen ACONC output for a CMAQv5.4+ run using different PE configurations when NPCOL is different
ANO3J
AOTHRJ
CO
NH3
NO2
O3
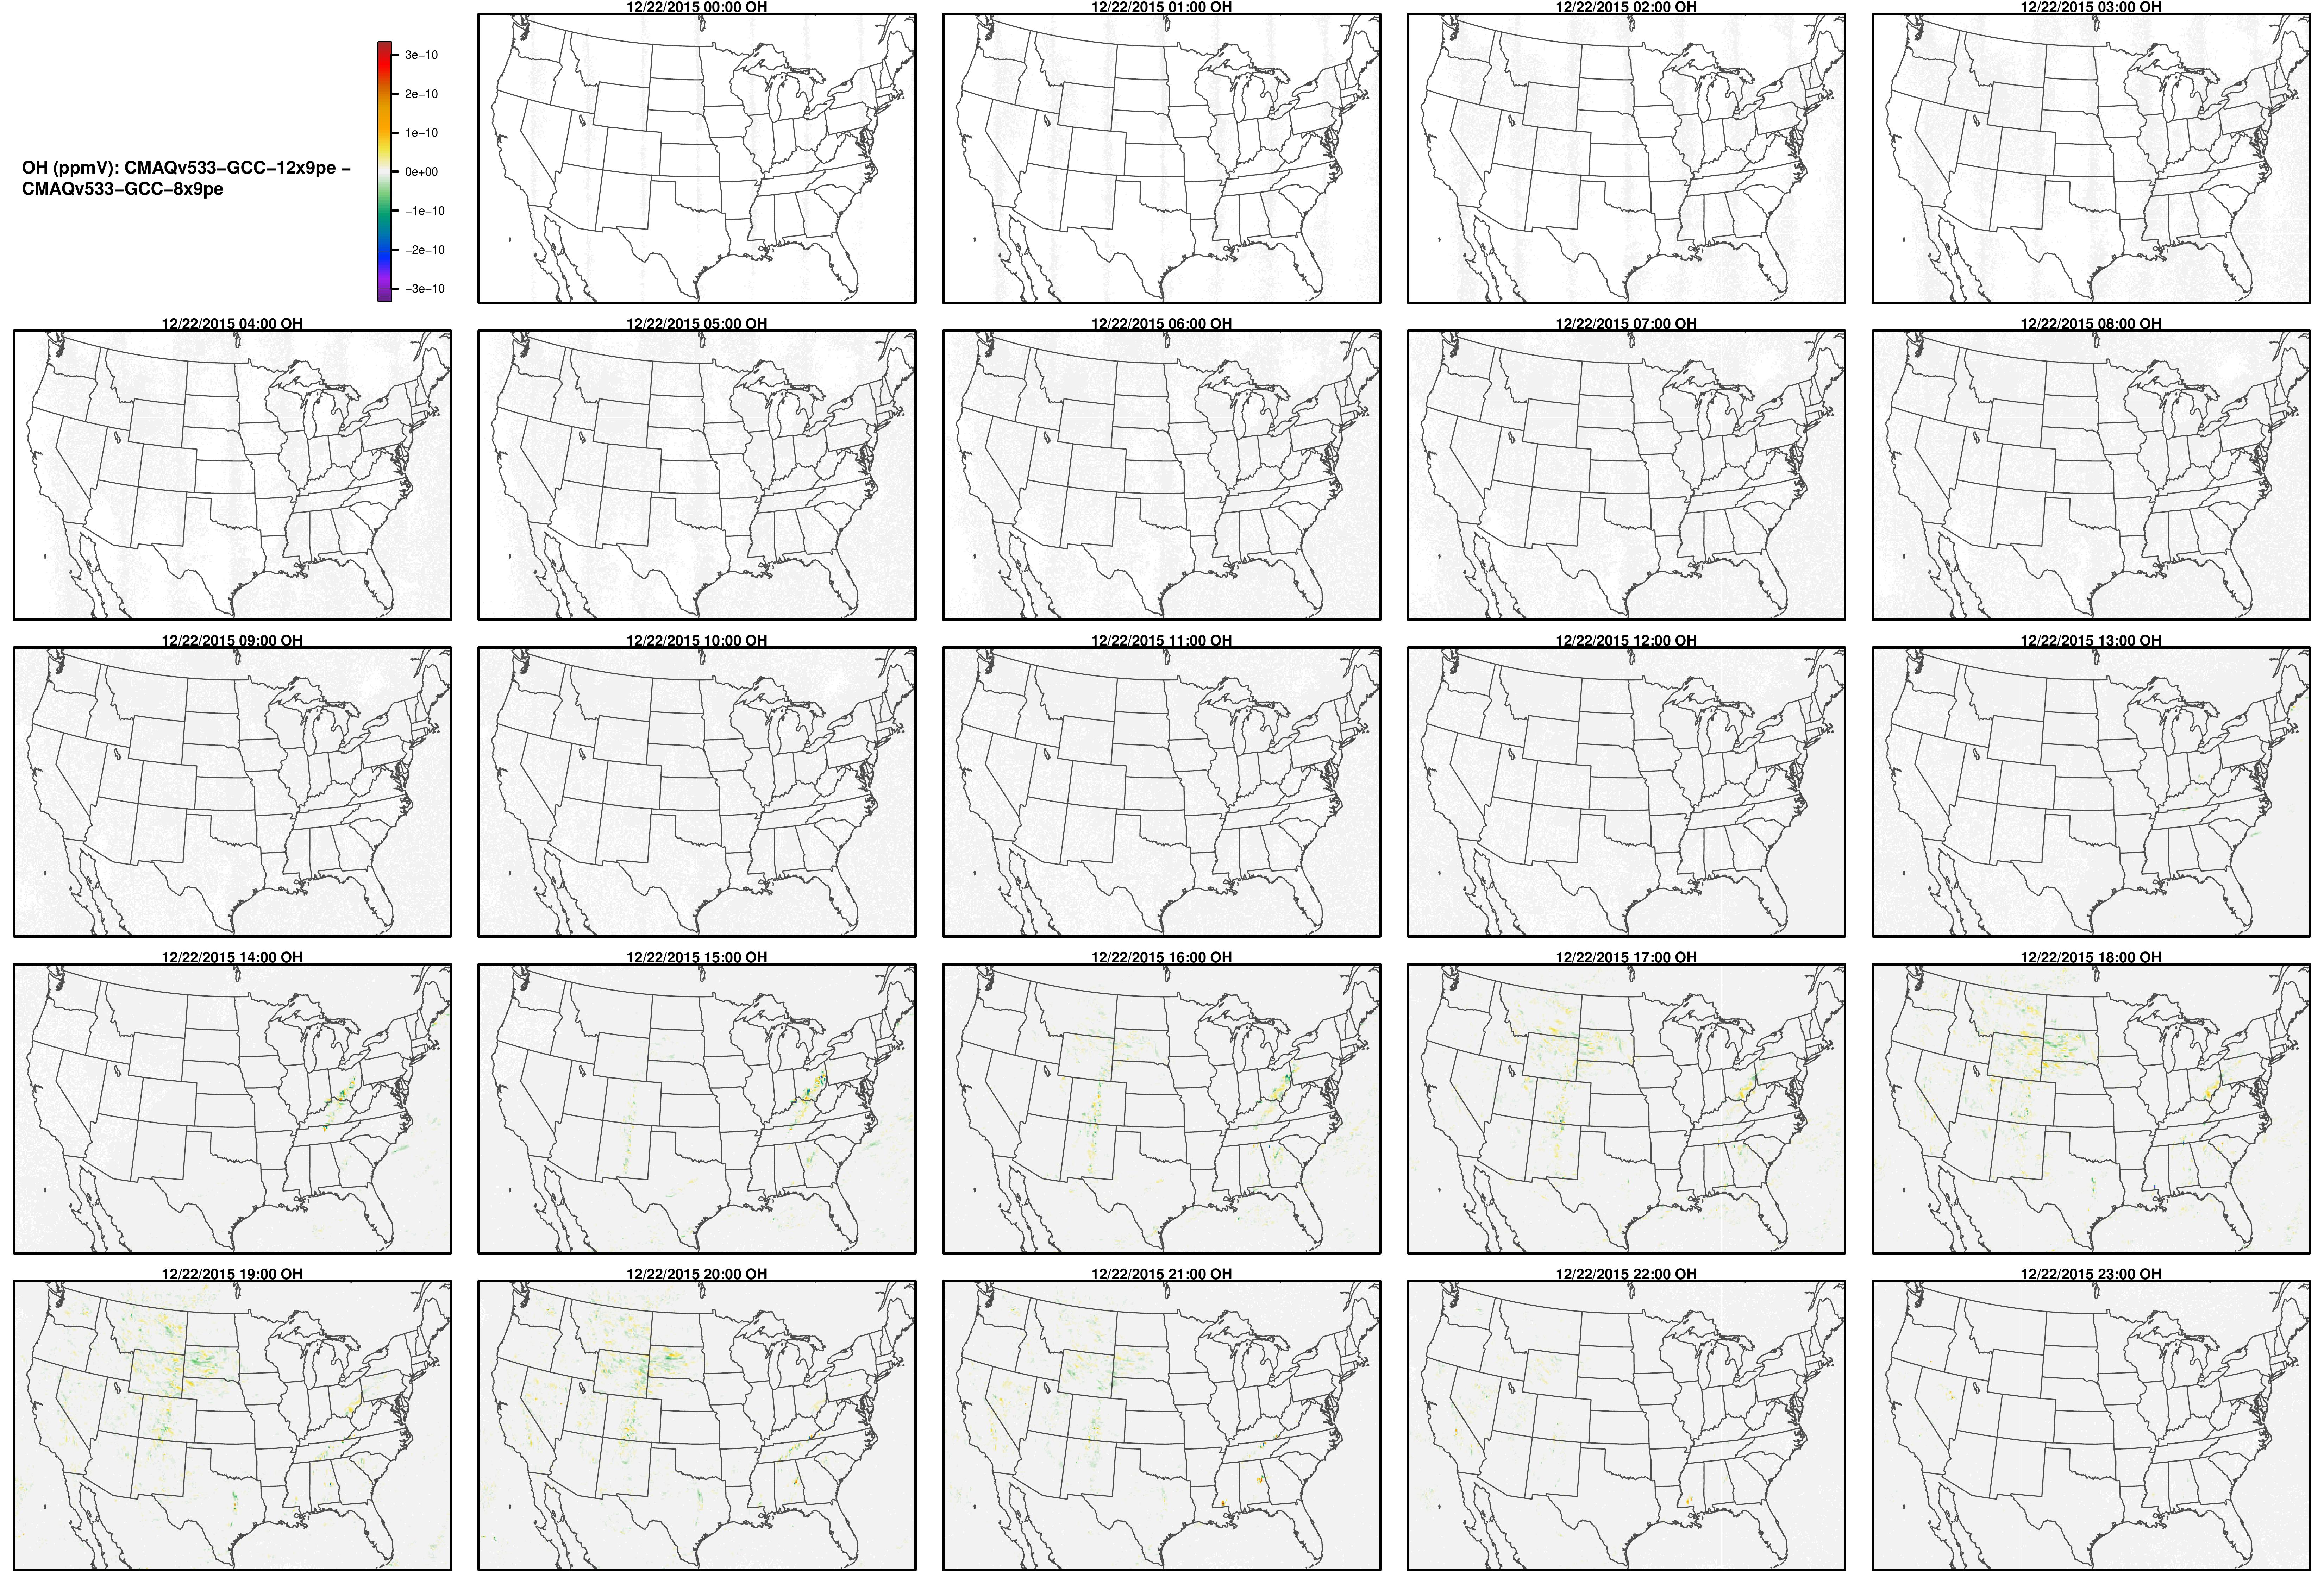
OH
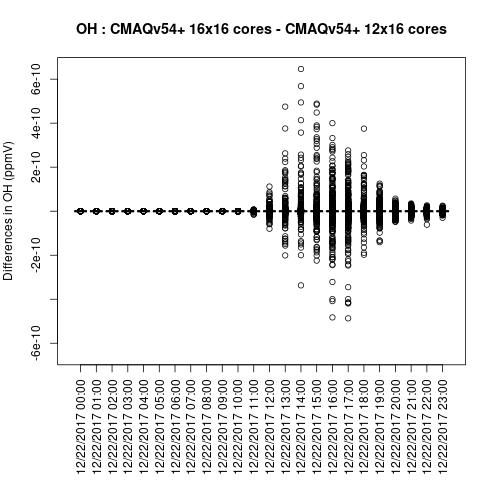
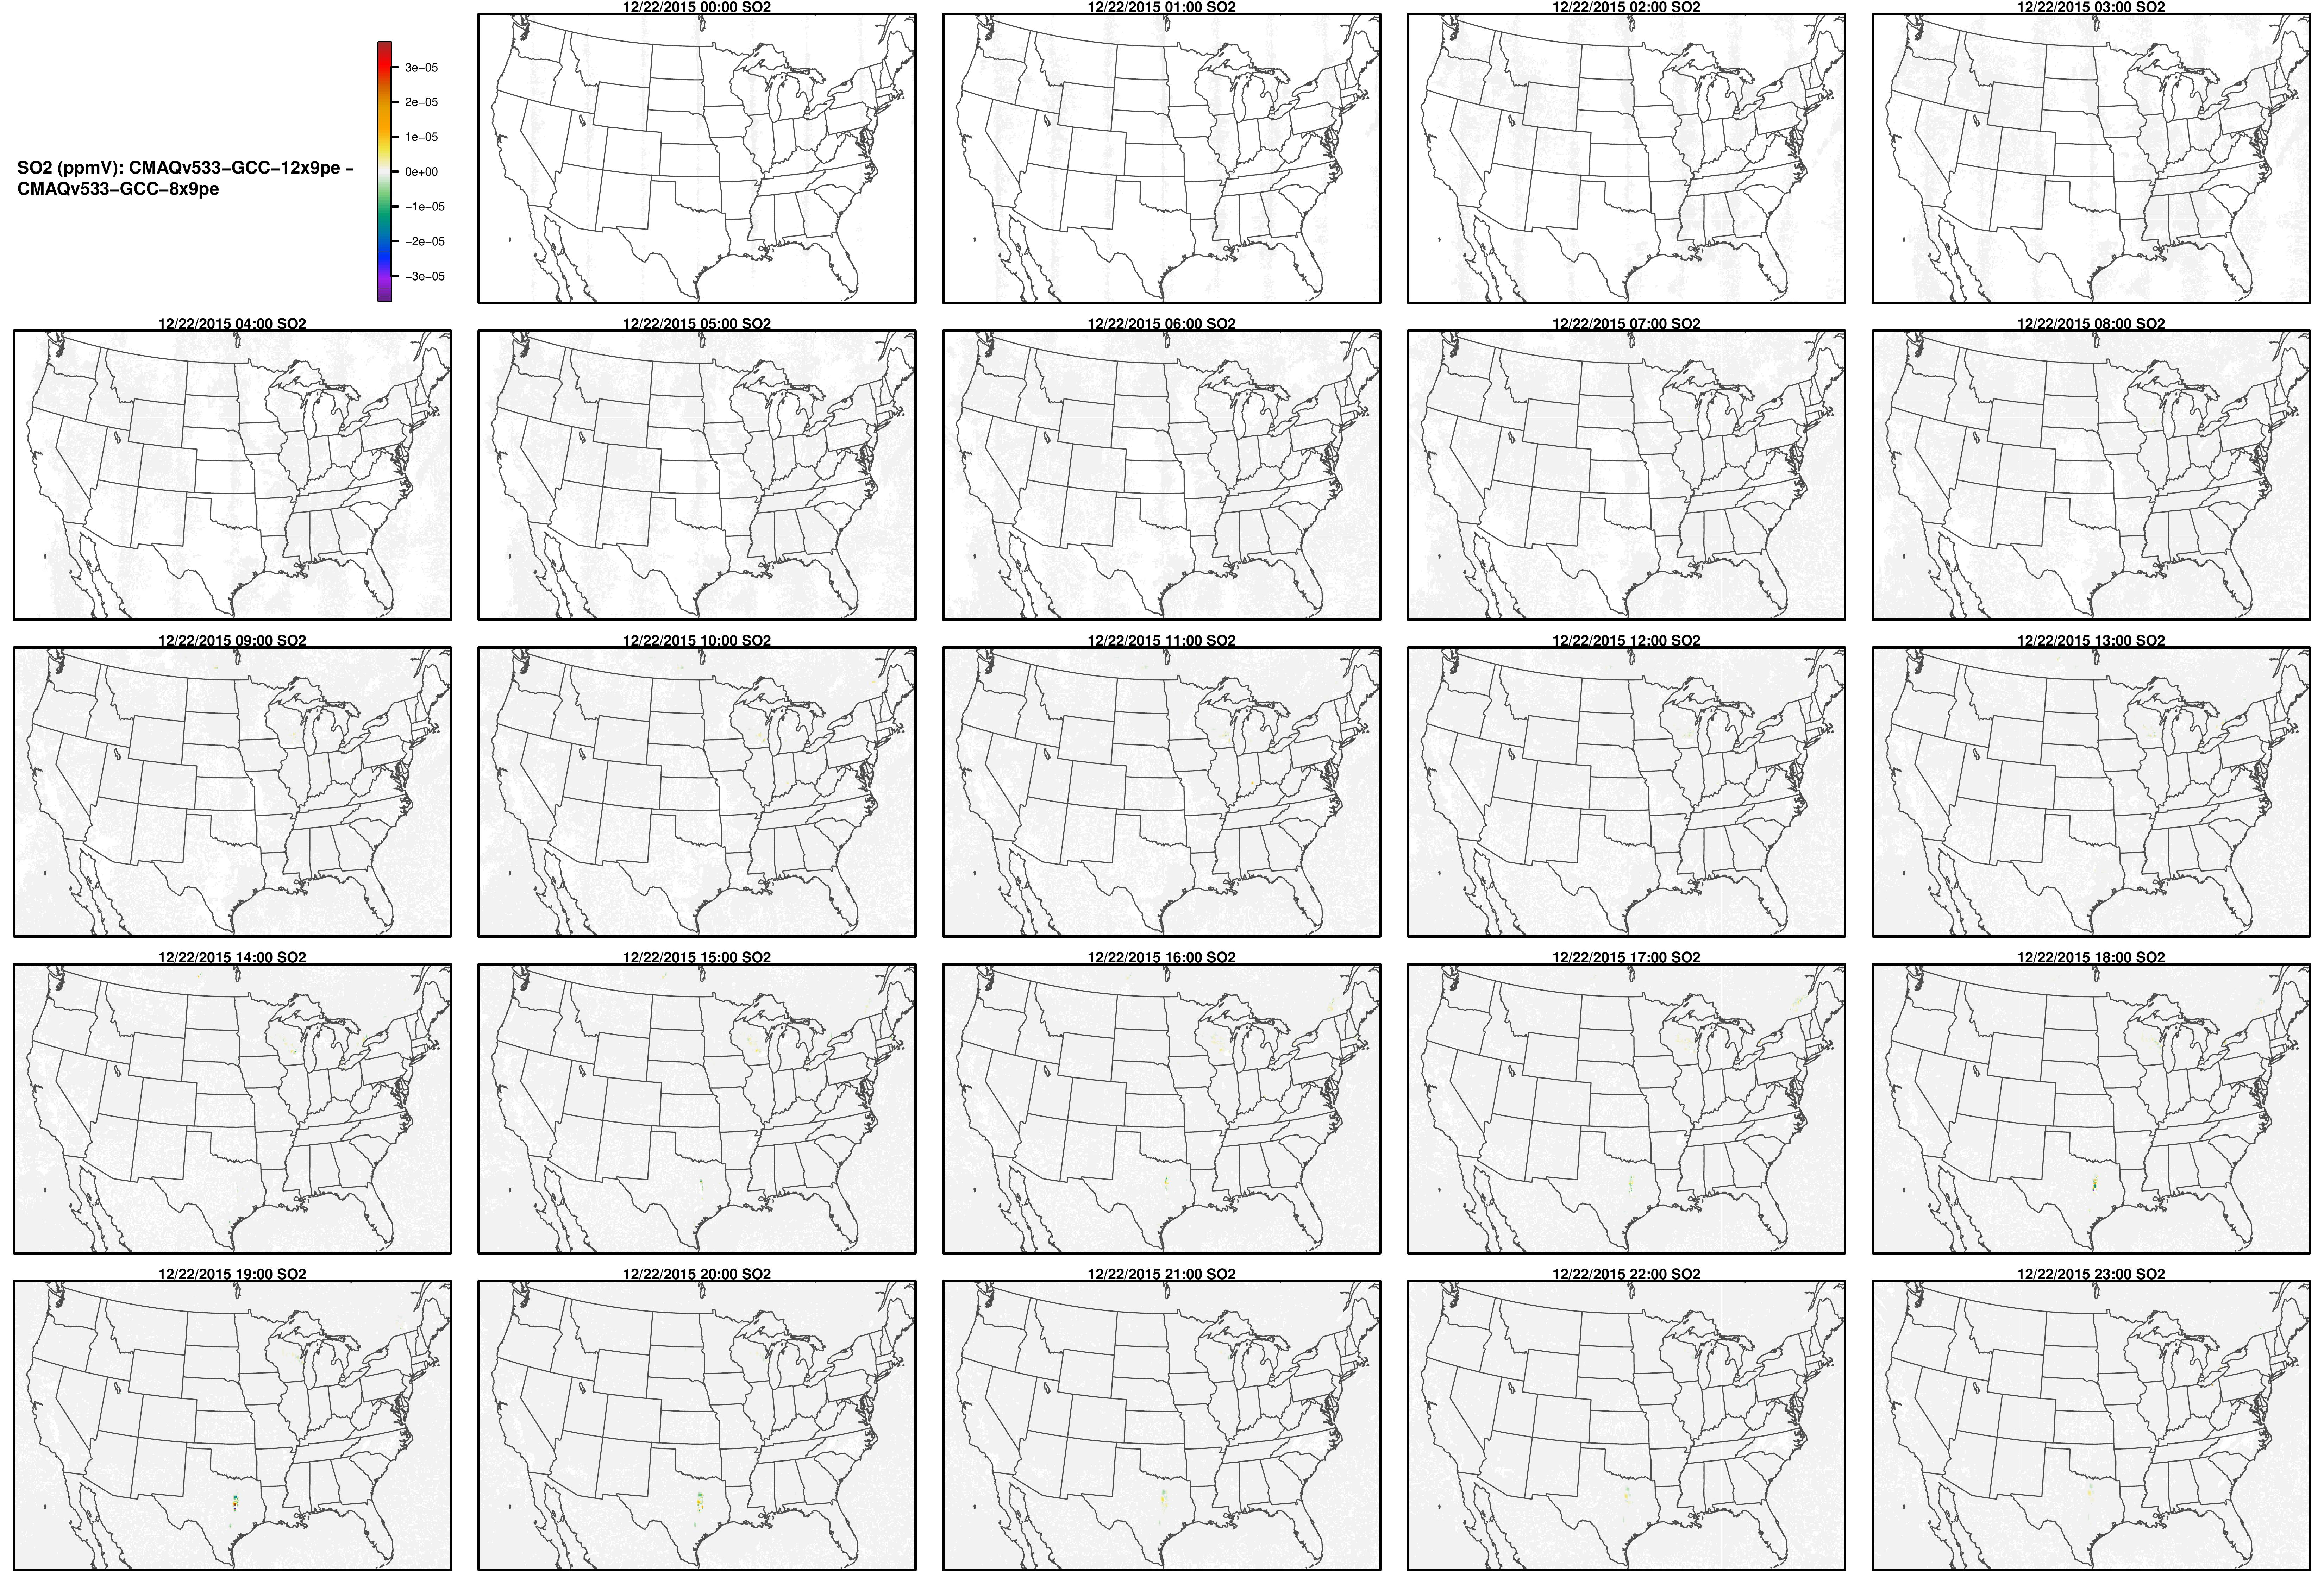
SO2
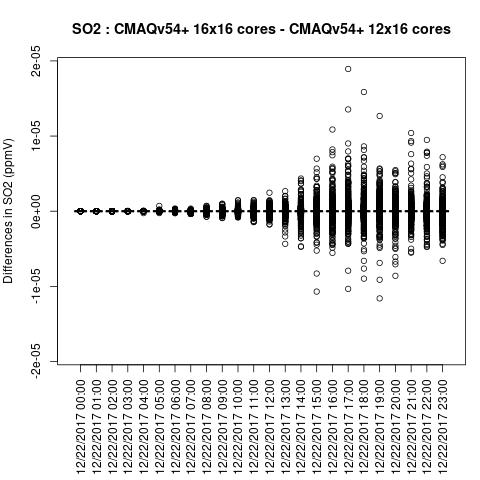
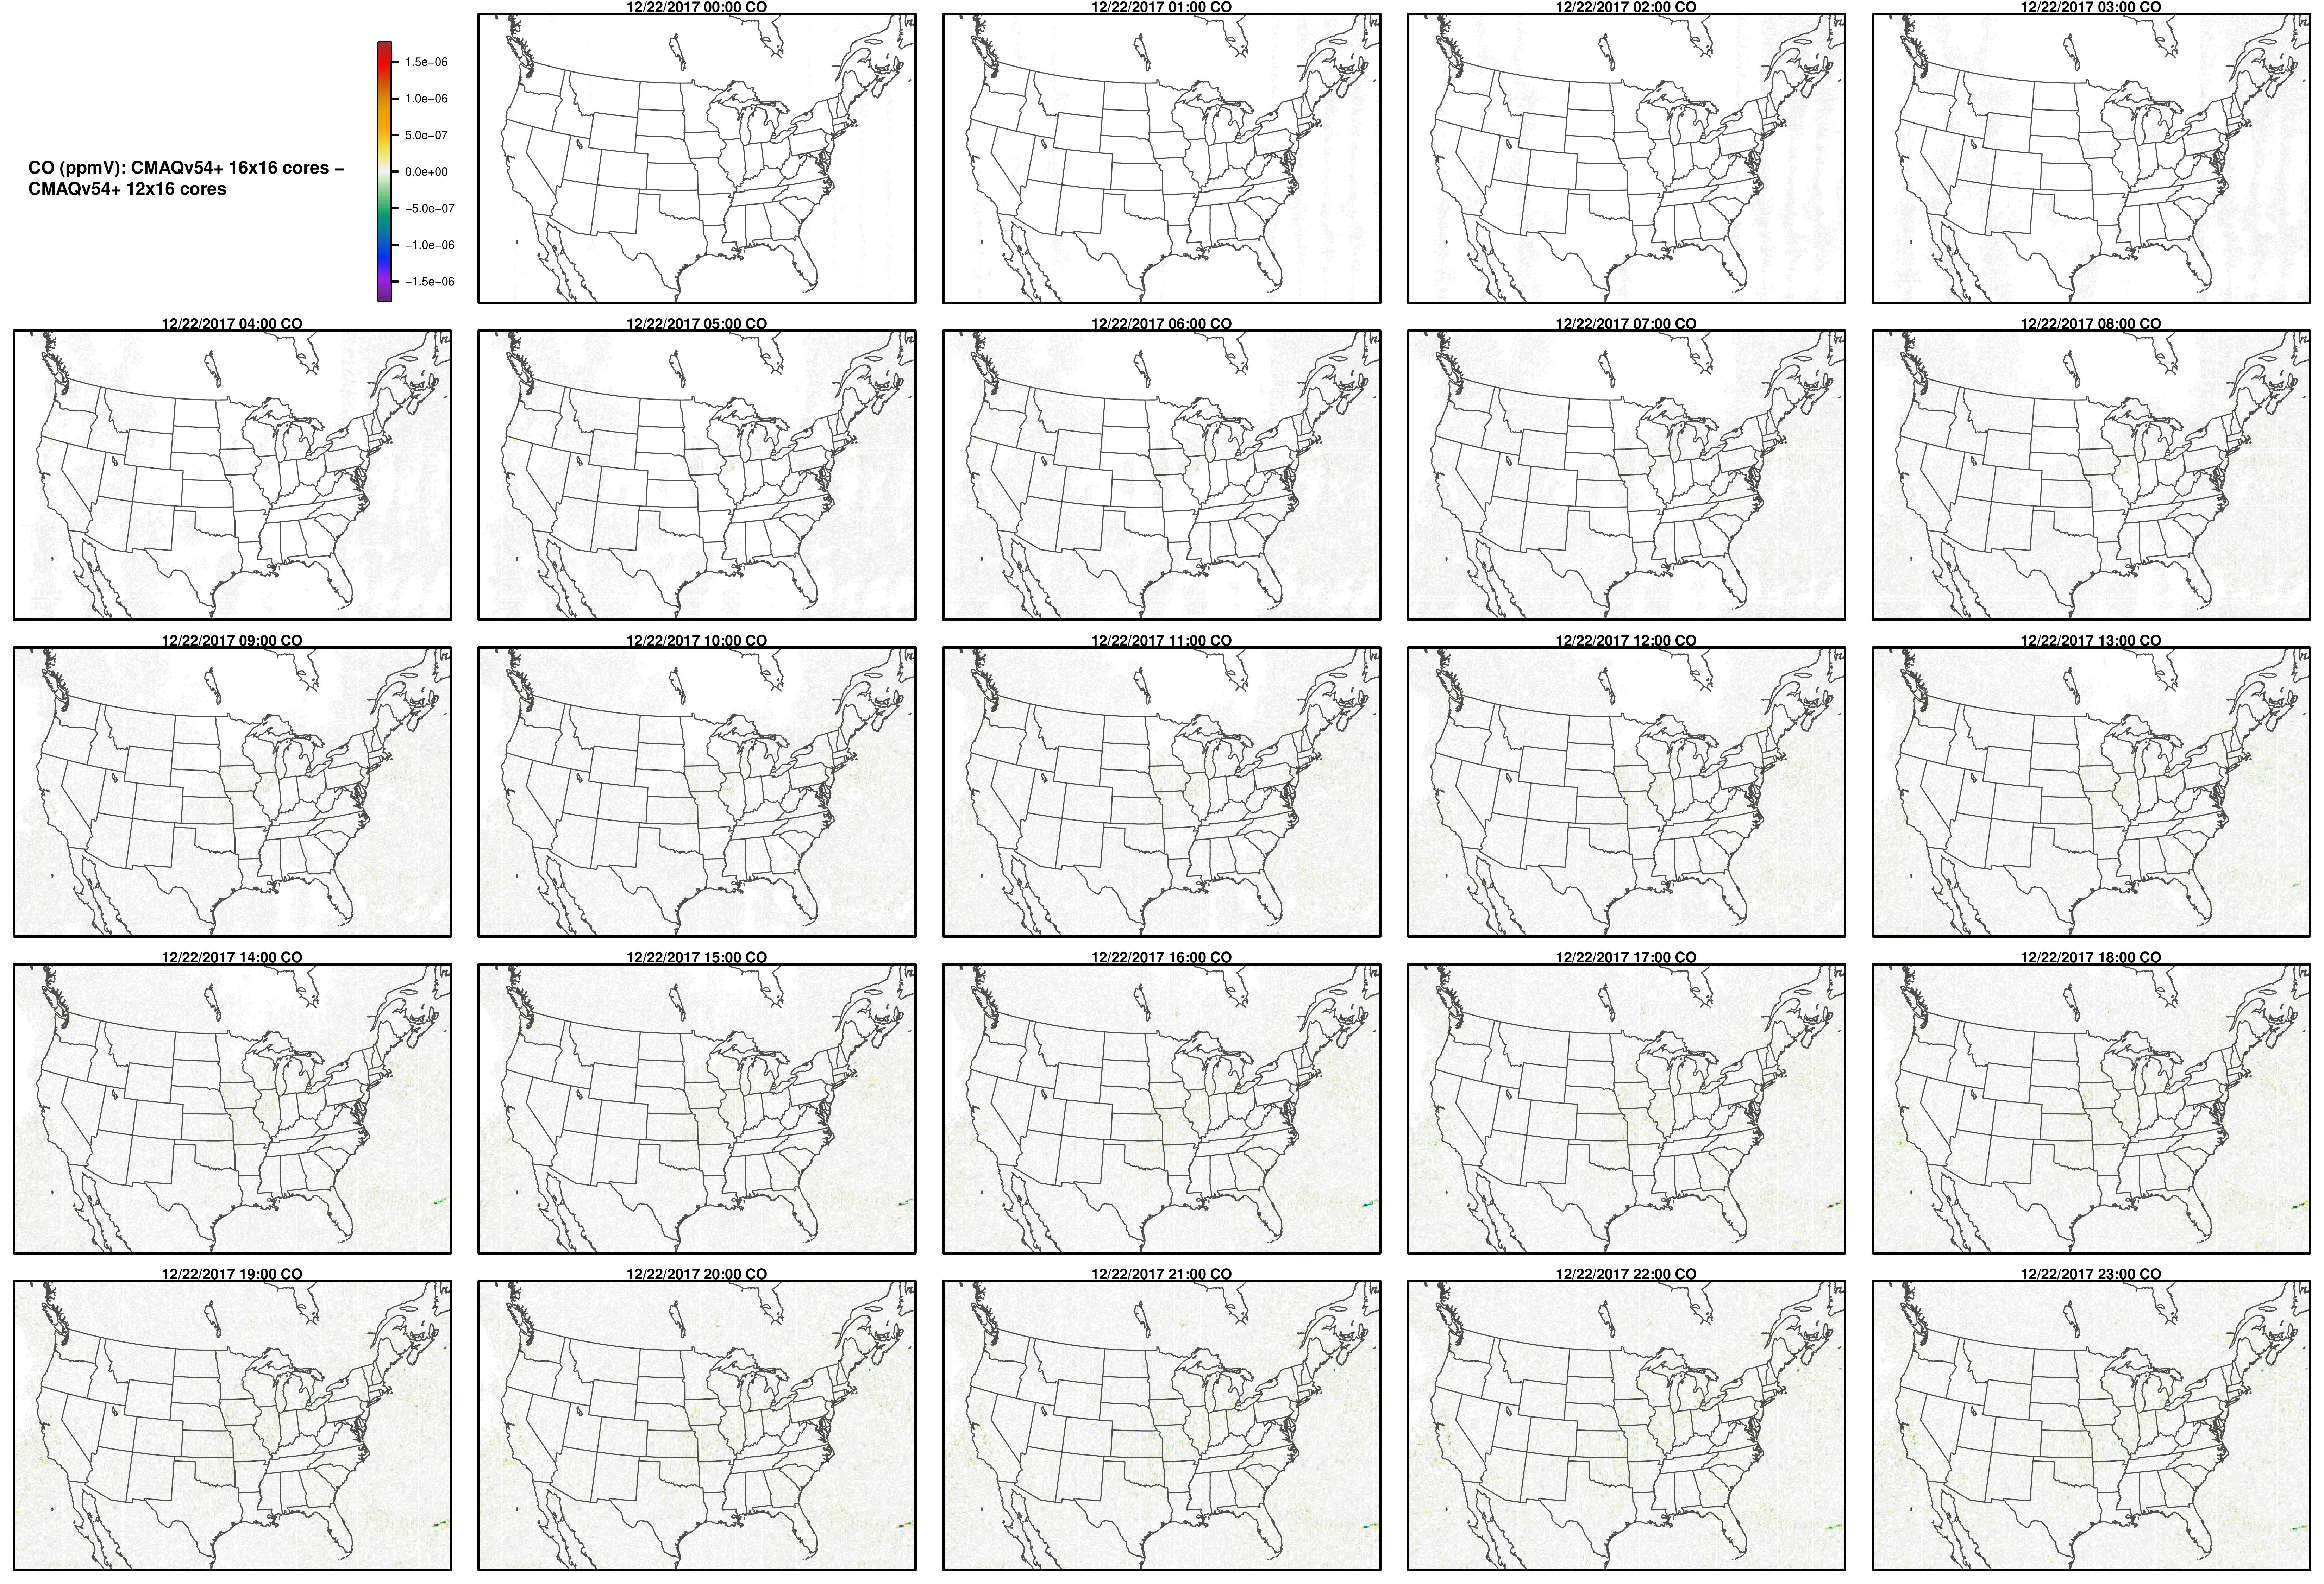
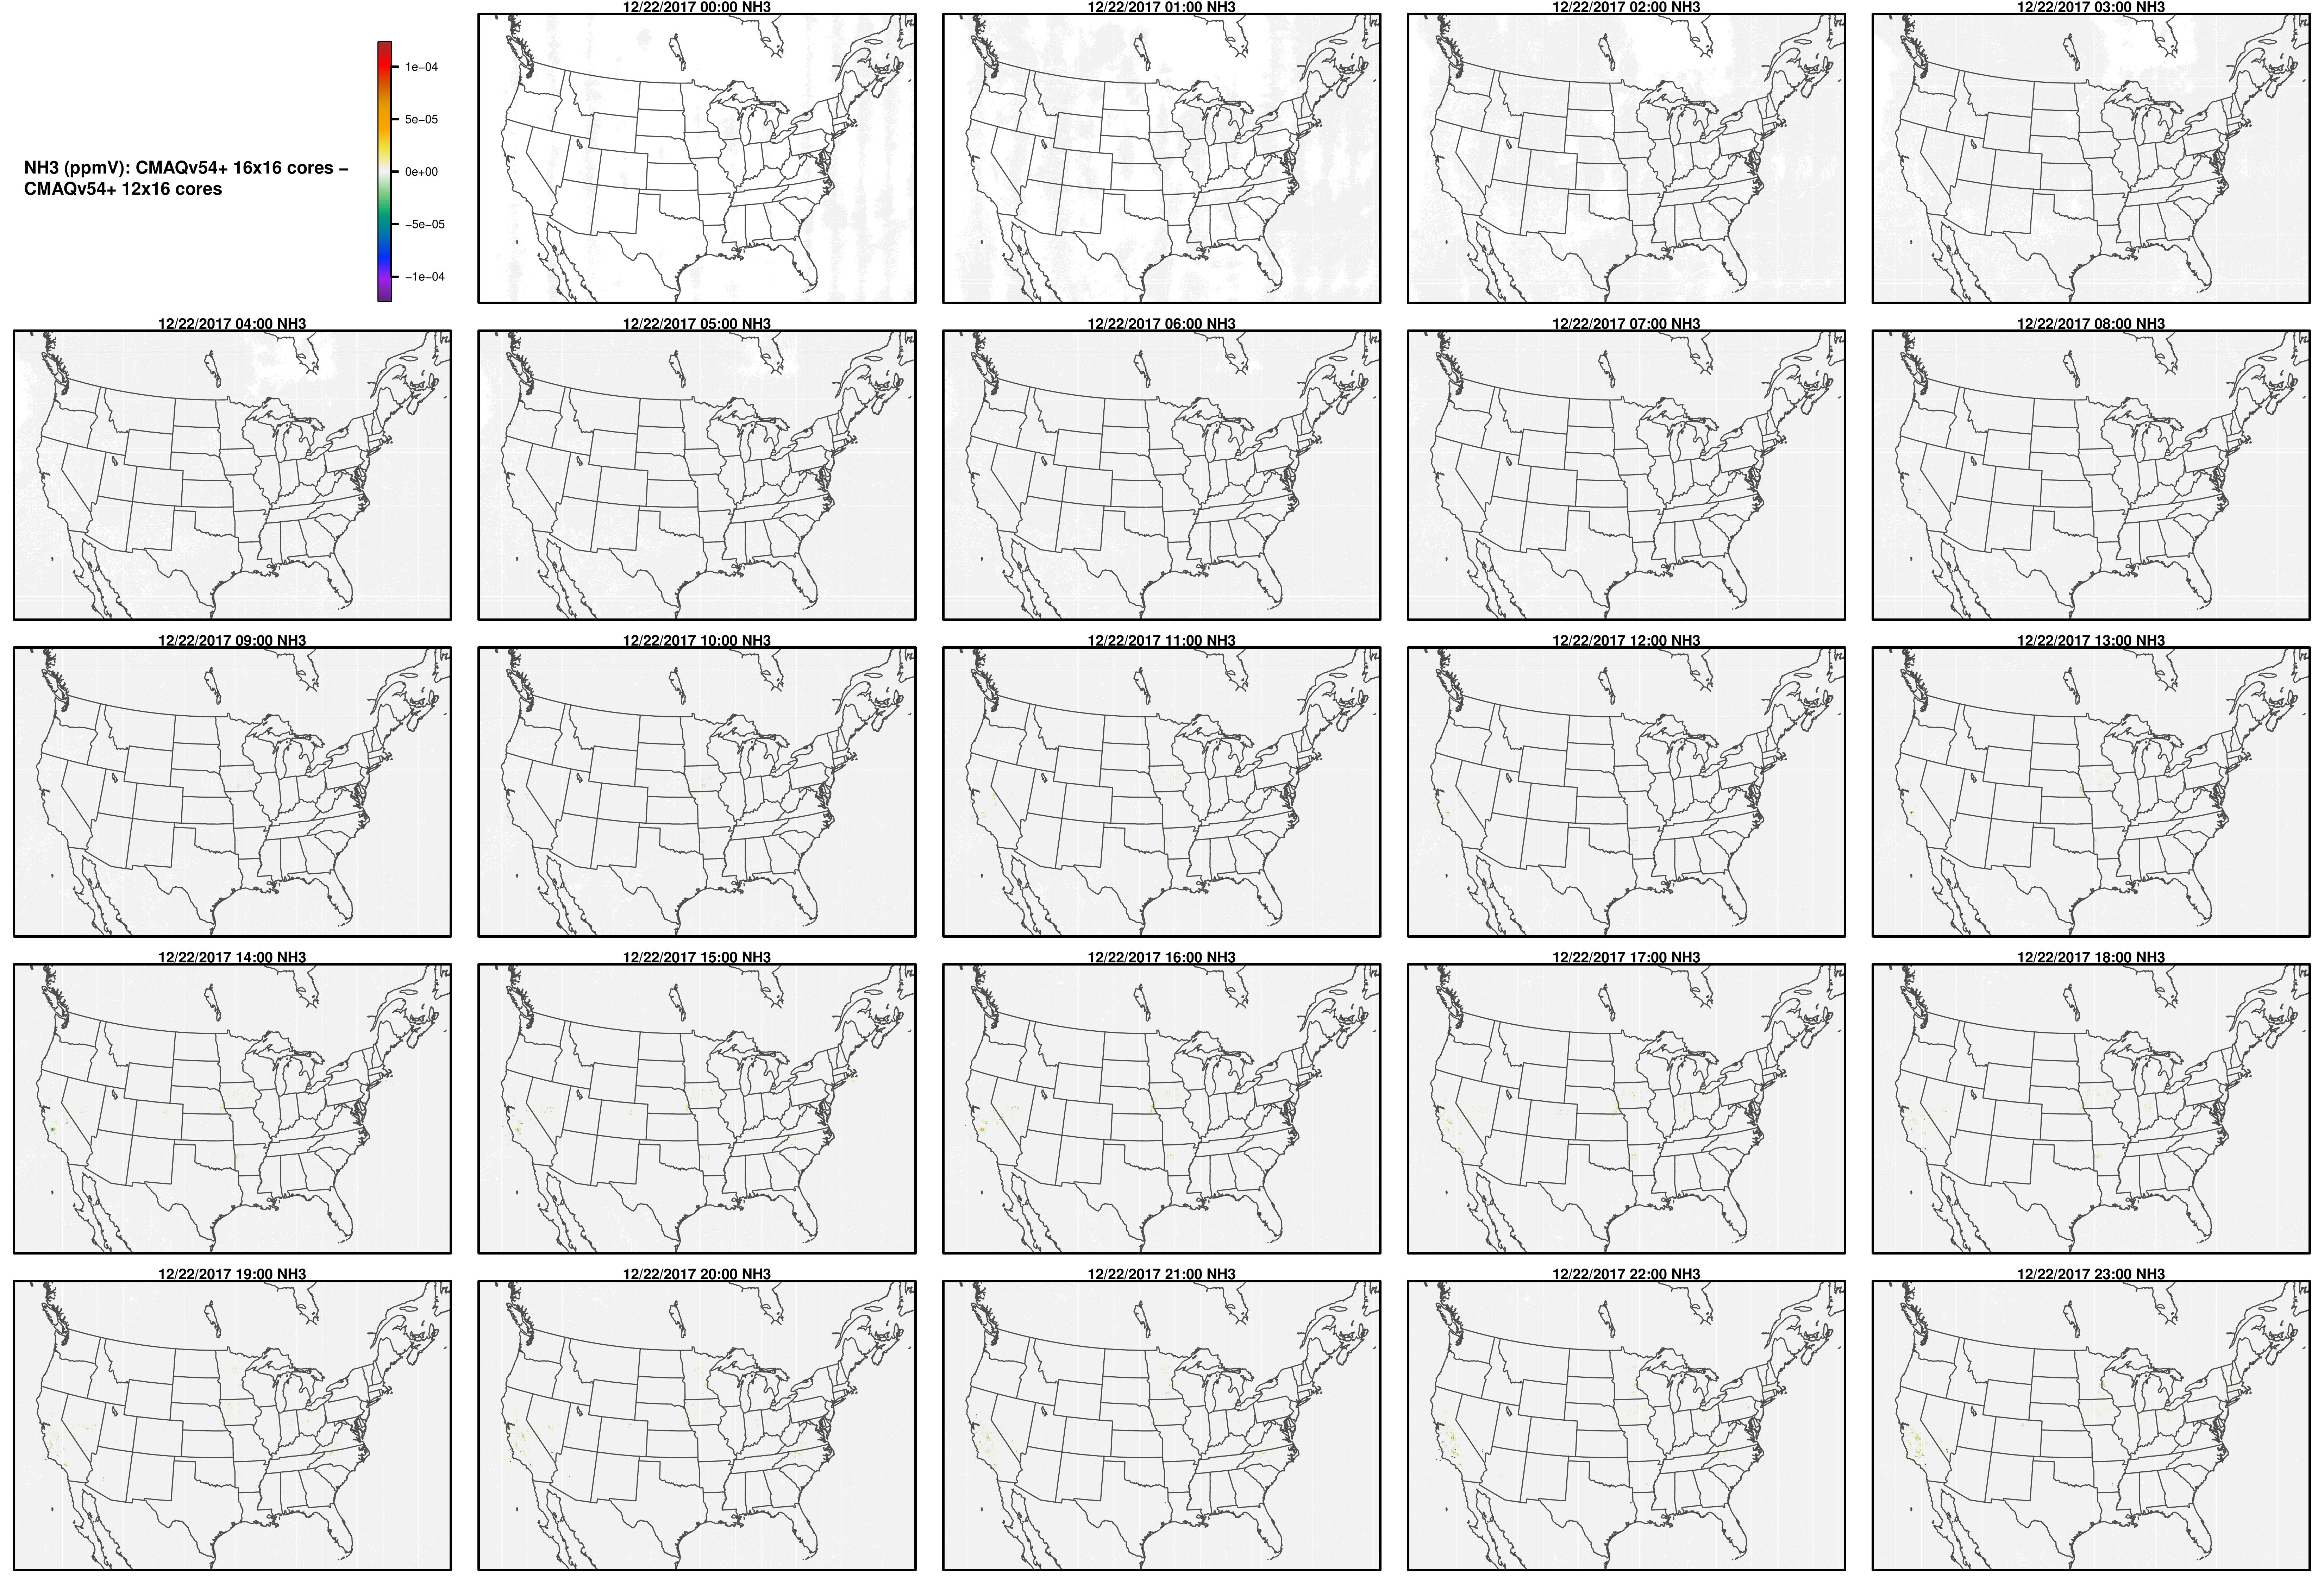
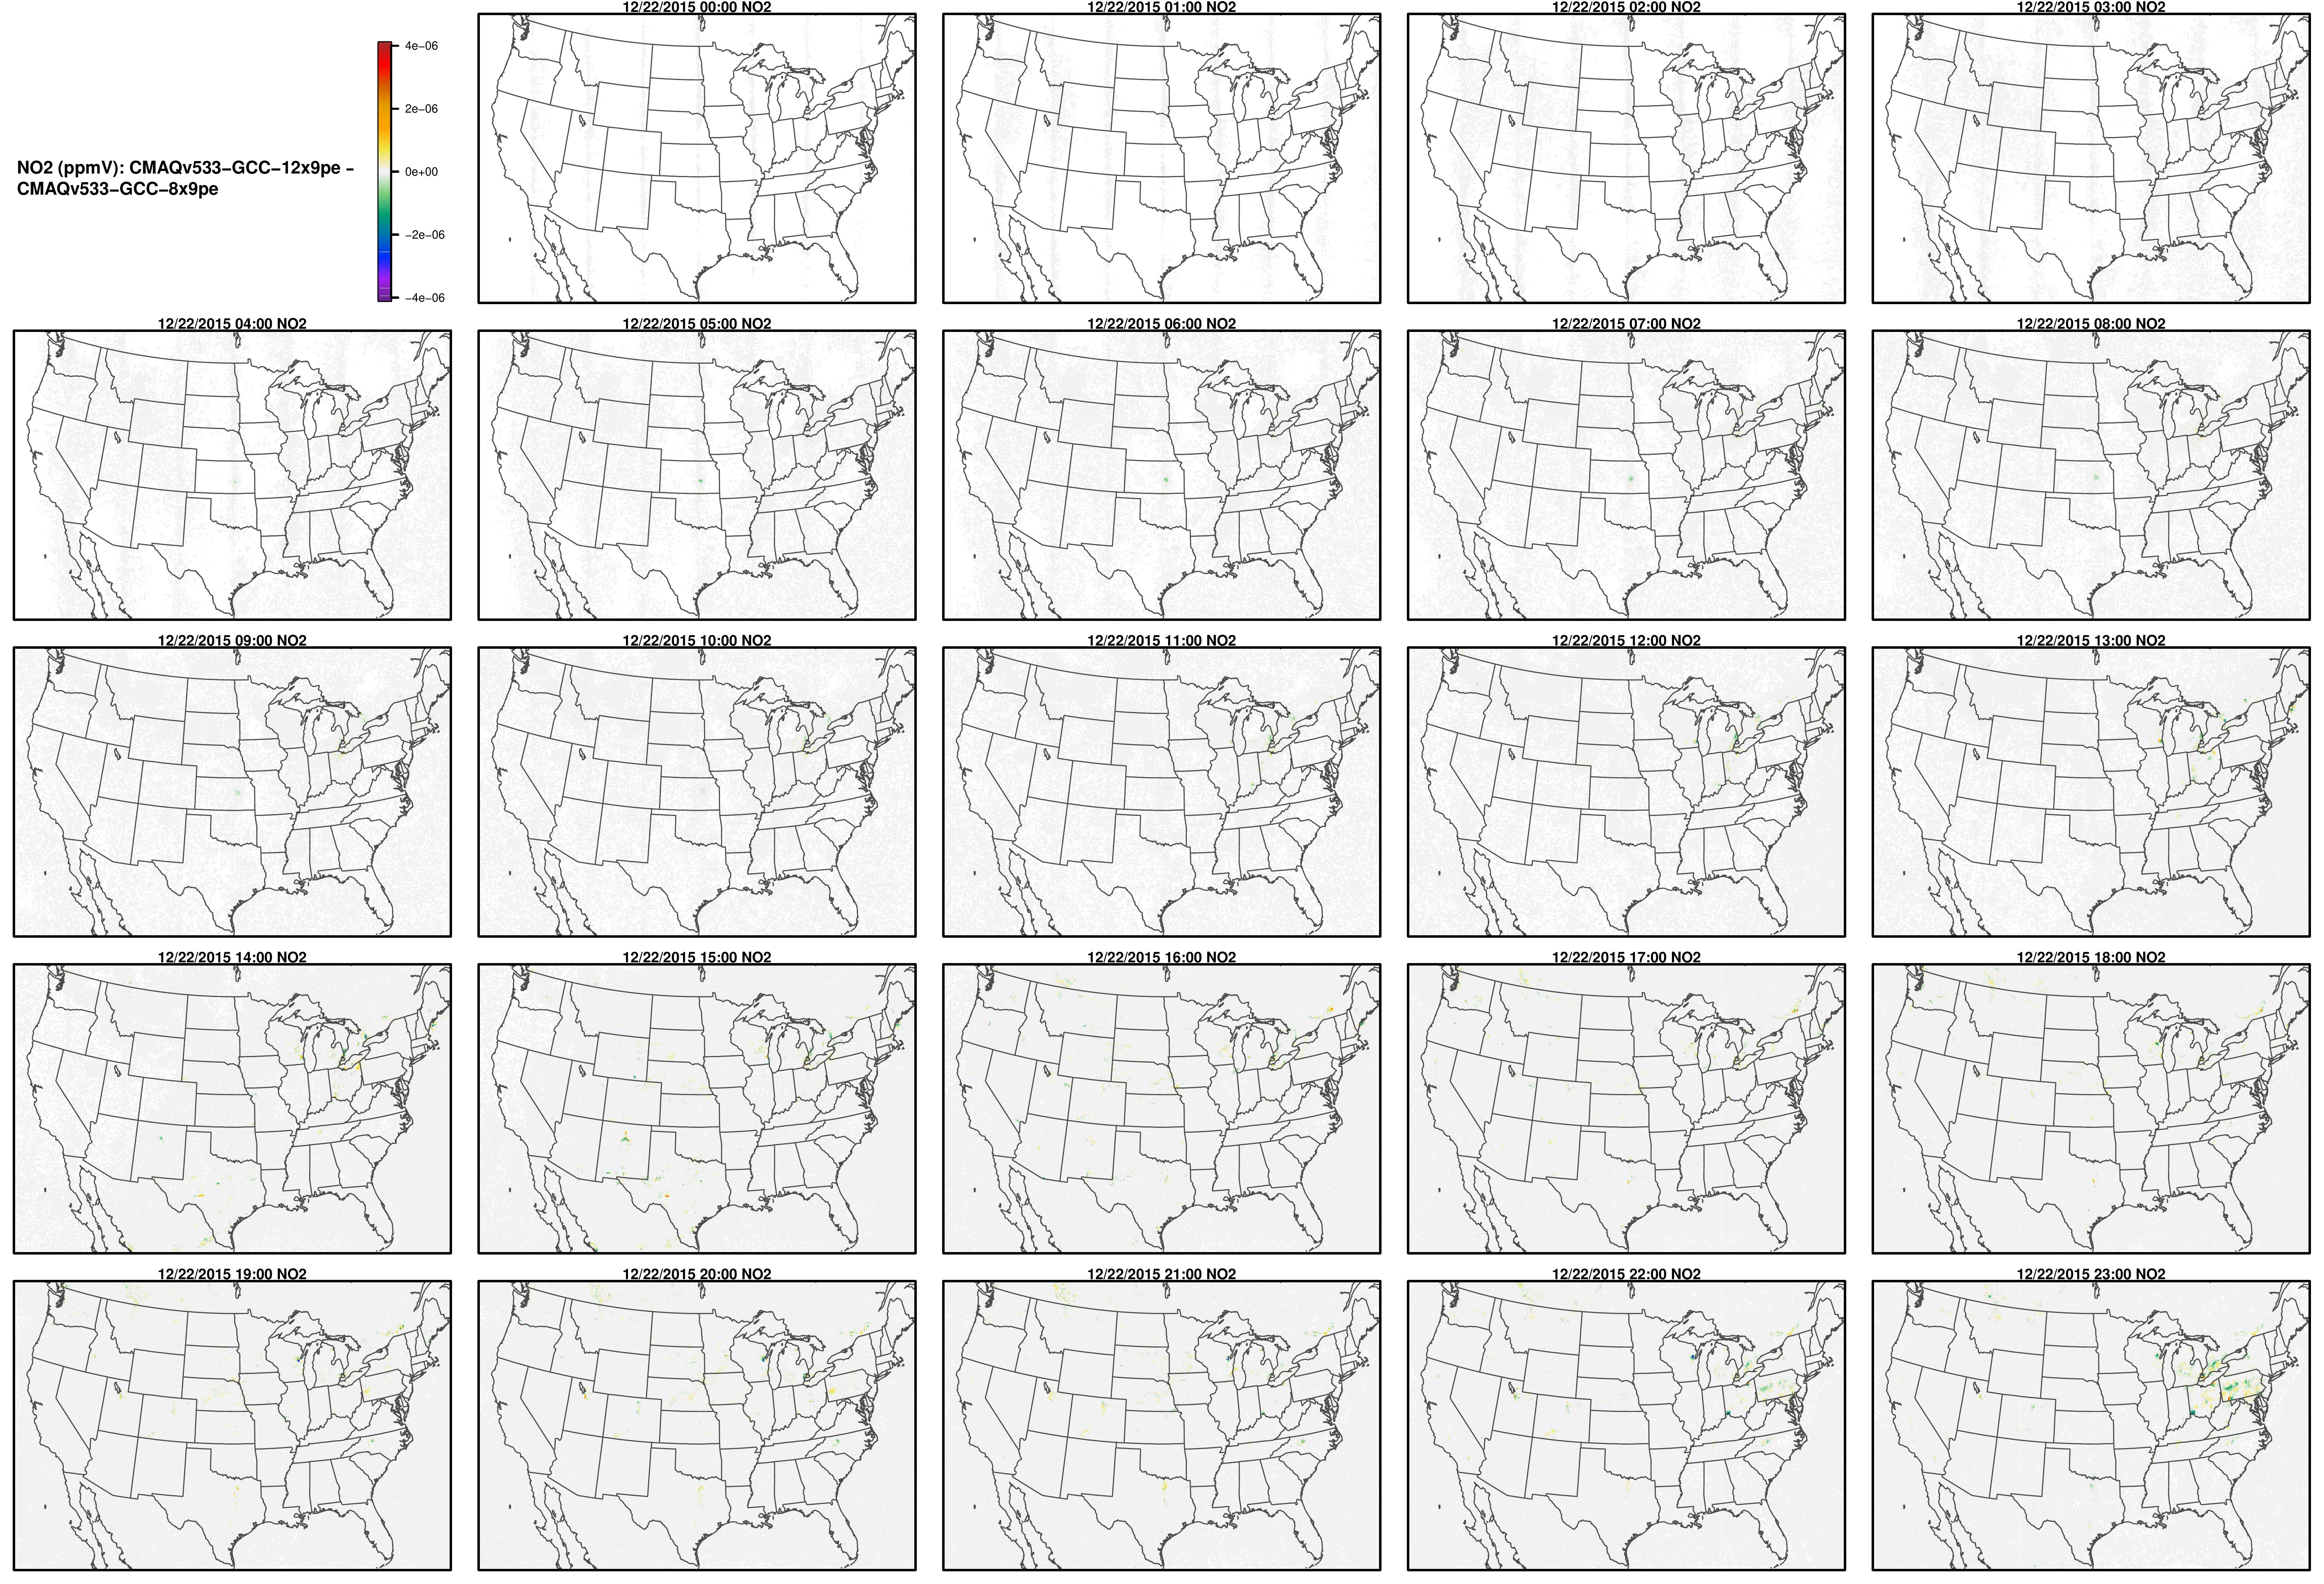
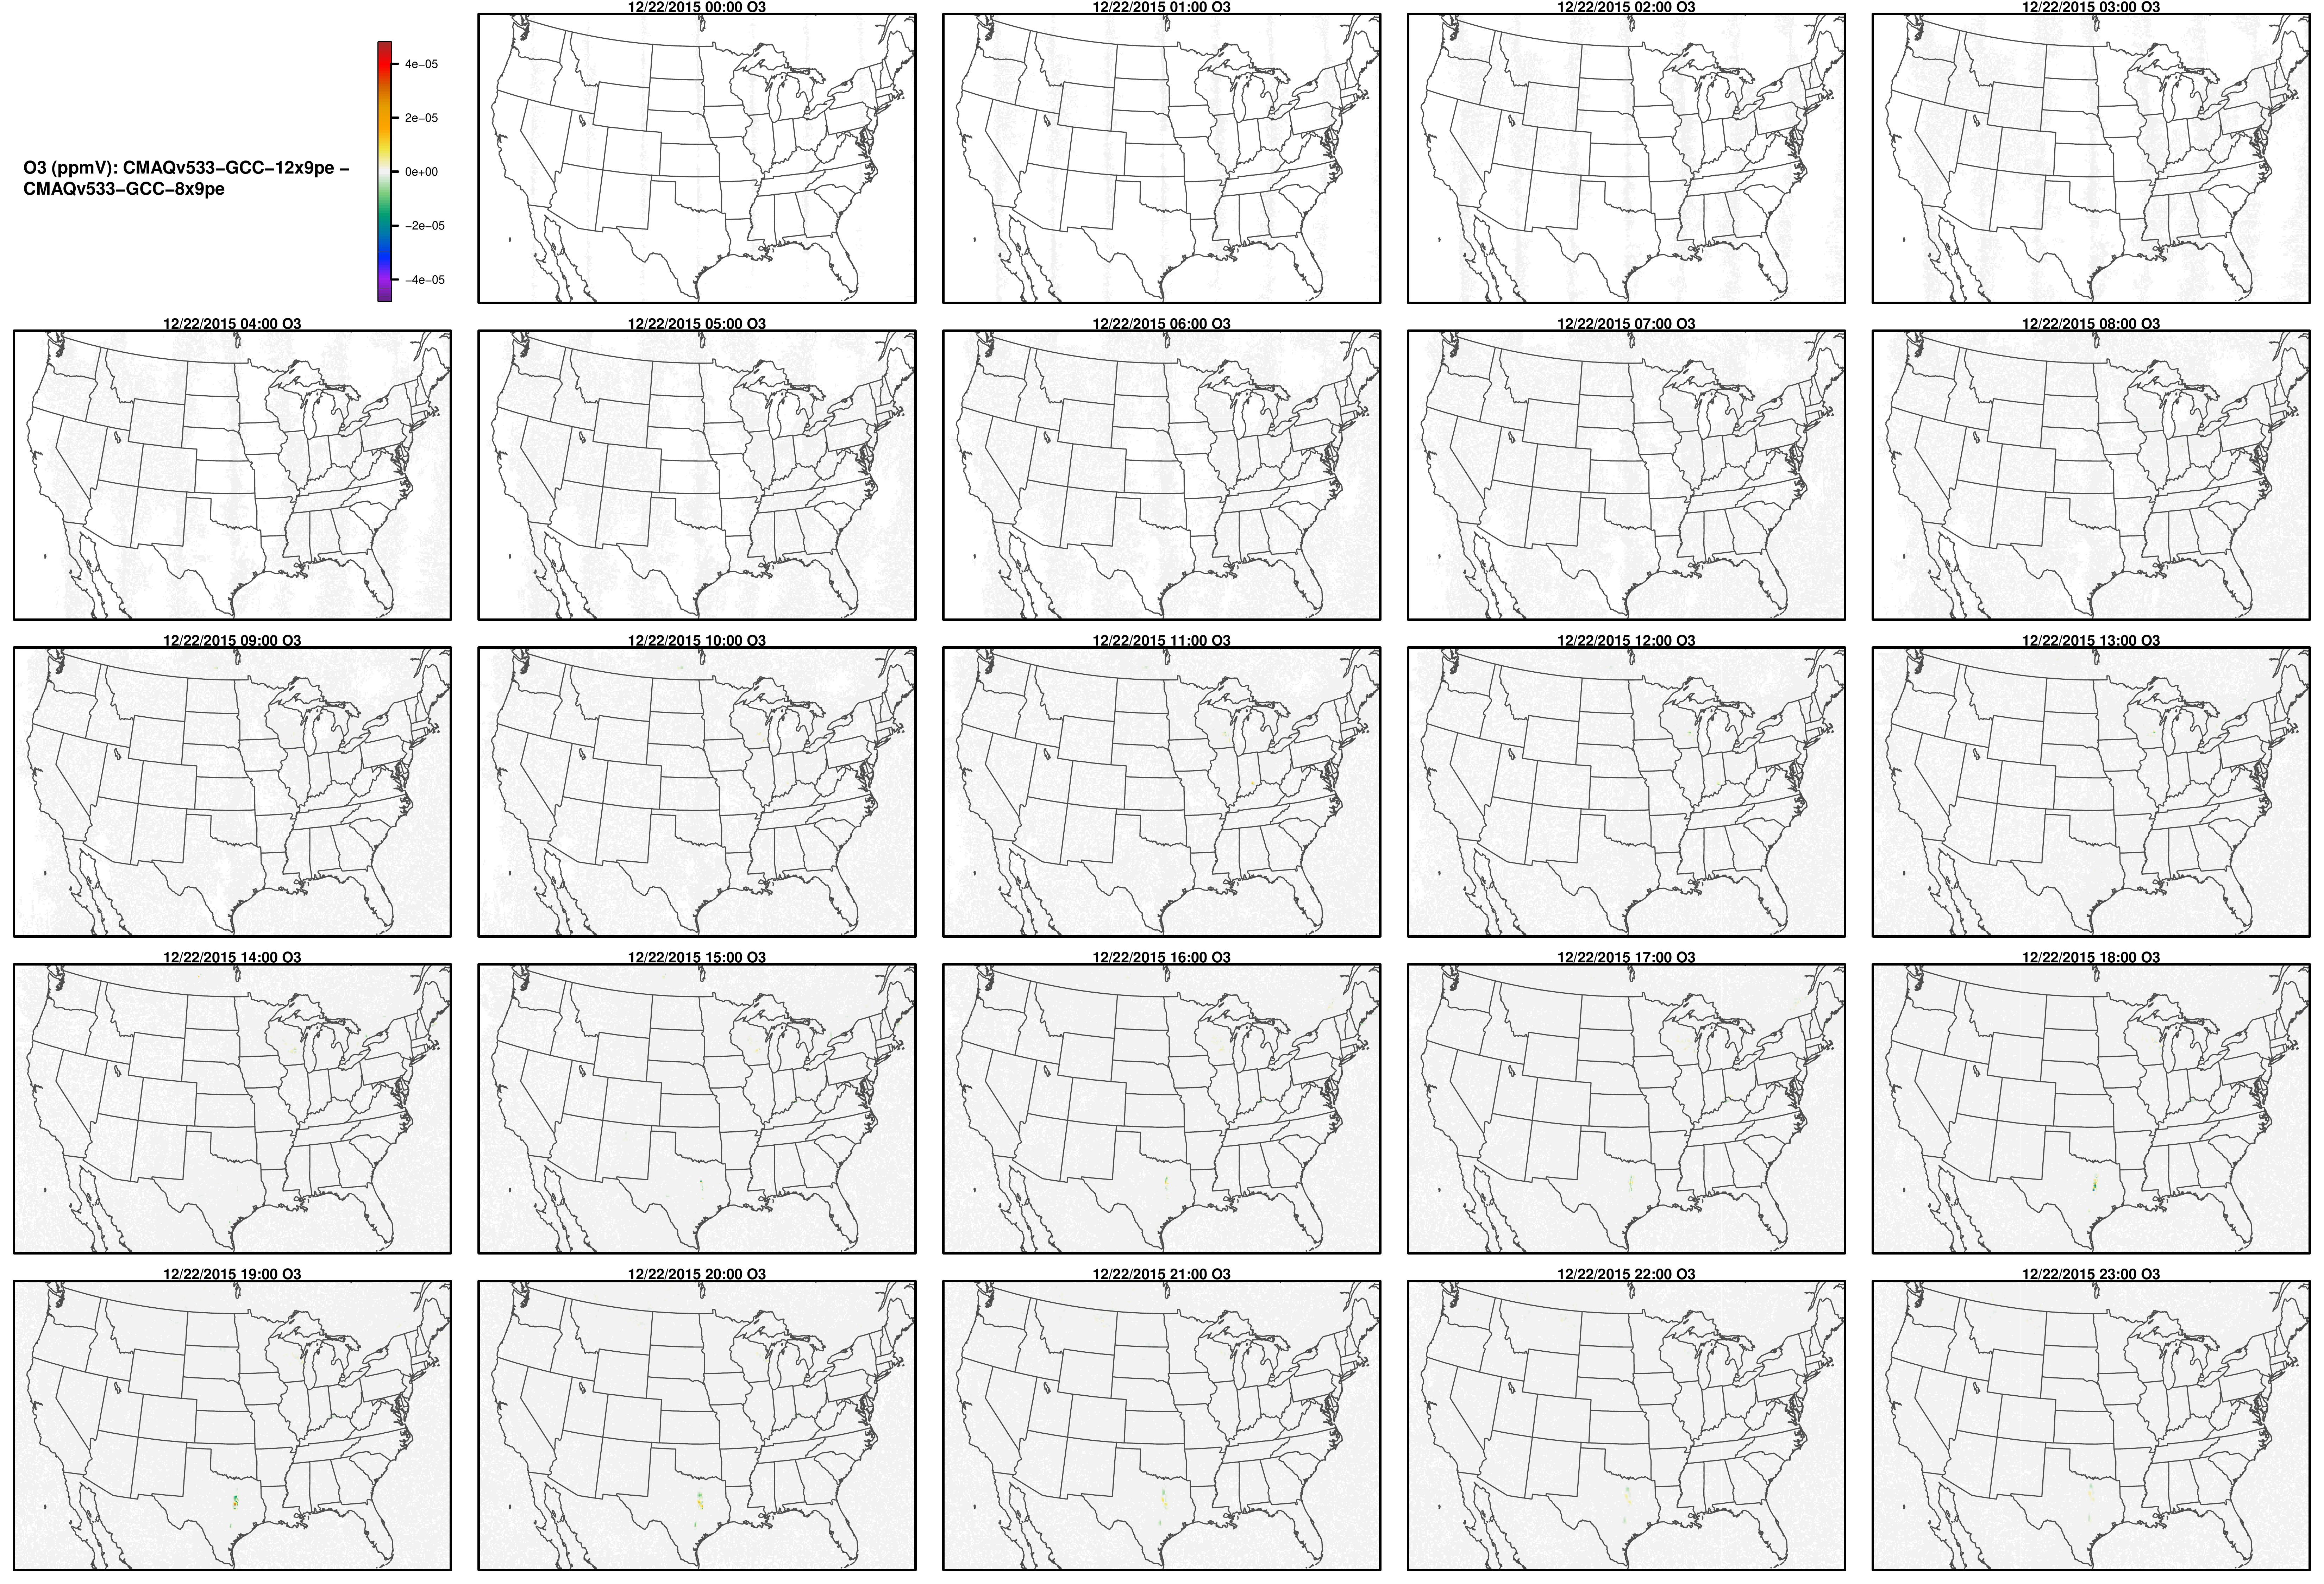
Note, the differences are small, but they grow with time. There is one plot for each of the 24 hours. The plot that contains the most differences will be in the bottom right of the panel for each species. You will need to zoom in to see the differences, as most of the grid cells do not have any difference, and they are displayed as grey. For the NO2 plot, you can see the most differences over the state of Pennsylvania at hour 12/22/2015 at hour 23:00, with the the magnitude of the maximum difference of +/- 4. E-6.
cd ../spatial_plots/16x16_vs_12x16
display O3_MAPS_CMAQv54+16x16cores_vs_CMAQv54+12x16cores-1.jpg
ANO3J
AOTHRJ
CO
NH3
NO2
O3
OH
SO2